You're spending ₹2 Lakhs monthly on Google Ads and Meta campaigns. CPCs are efficient, CTR is healthy, targeting is precise. But your lead cost is ₹3,000 when competitors charge ₹800. The problem isn't your ads — it's what happens after the click.
Landing page conversion rates in India average 2-4%. Top performers convert at 8-15%. That 3-4× difference translates directly to 3-4× revenue from identical budgets. A CRO audit identifies exactly why visitors leave without converting. Our digital marketing team runs CRO audits across industries — these are the five friction points we find in 90% of audits.
1. What a CRO Audit Reveals
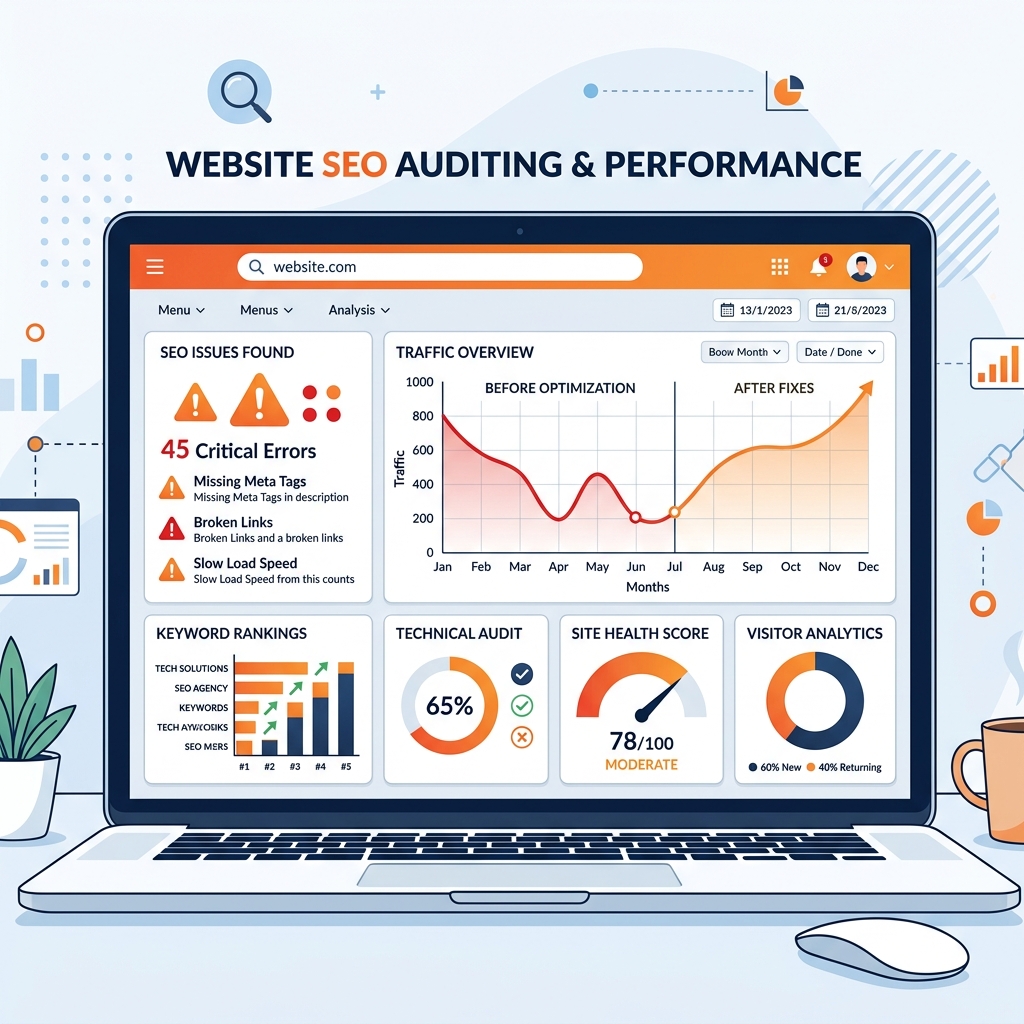
Tools used in a professional CRO audit:
- Heatmaps (Hotjar, Microsoft Clarity): Where visitors click, scroll to, and stop reading
- Session recordings: Actual user sessions showing mouse movement, rage-clicks, exit patterns
- Form analytics: Which specific form field causes 60% of abandonment
- A/B testing (VWO, Google Optimize): Statistical validation before full rollout
2. Friction 1: Weak Value Proposition Above the Fold
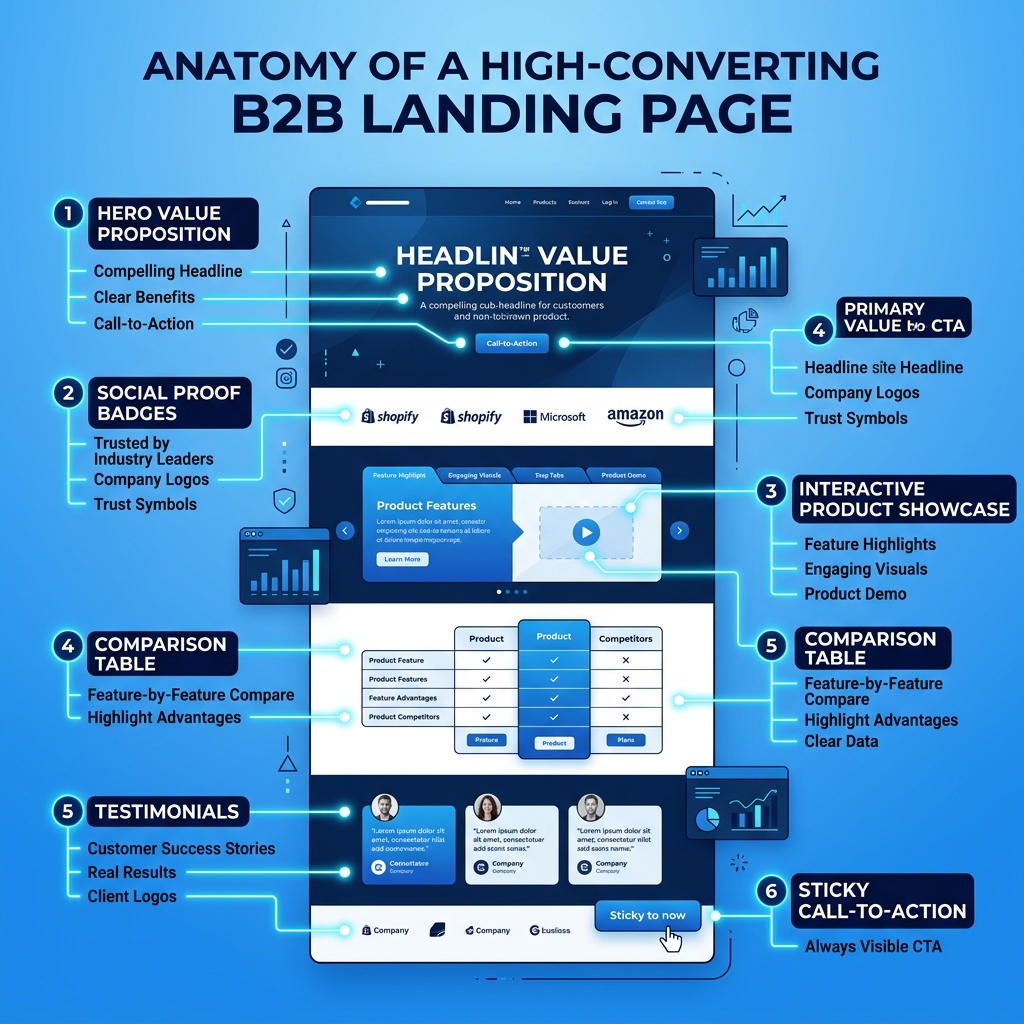
The above-fold section has 3-5 seconds to communicate why visitors should stay. Most Indian landing pages waste this with generic headlines like "Welcome to ABC Company."
Fix: PPPP Formula
- Promise: One specific outcome headline ("Get 3X More B2B Leads Without Increasing Ad Spend")
- Picture: One high-quality image showing the outcome, not the product
- Proof: One data point ("432 Indian businesses generated ₹10Cr+ revenue")
- Push: One clear CTA button above the fold
Indian consumers are highly skeptical. Specificity increases credibility: "Increase leads" → low trust. "Increase qualified leads by 67% in 45 days for service businesses in India" → high trust. Specificity signals you've actually achieved it.
3. Friction 2: Overloaded Lead Capture Forms
Forms with 5+ fields consistently convert 50-70% worse than 2-3 field forms. Yet most Indian B2B pages ask 7-8 fields.
Fix: Progressive Profiling
- Step 1 (above fold): Just Name + WhatsApp Number. 2 fields converts 3-4× better than 7
- Step 2 (follow-up): Ask one qualifying question per touchpoint
- WhatsApp CTA as primary: "Chat on WhatsApp" outperforms email forms by 40-60% for Indian audiences
4. Friction 3: Missing Trust Signals
Trust Signal Hierarchy for Indian audiences (most to least impactful):
- Client logos from recognizable Indian brands
- Video testimonials with real customer name + company shown on screen
- Google My Business rating badge (verifiable social proof)
- Specific case study metrics ("312% organic traffic increase for XYZ brand in Surat")
- Media mentions (YourStory, Inc42, Economic Times)
- Guarantee language ("100% Money-Back if No Results in 60 Days")
5. Friction 4: CTA Placement and Copy Failures
- Multiple placements: Pages with 3-5 CTAs (top, middle, bottom) outperform single-CTA by 25-35%
- Specific CTA copy: "Submit" converts ~1%. "Get My Free SEO Audit" converts 4-7%
- Contrast color: CTA must strongly contrast with background. Color alone changes conversions 10-15%
- Urgency/scarcity: "Limited slots this month" activates loss aversion — powerful for Indian buyers
6. Friction 5: Mobile UX Breakdowns
85% of Indian visitors are on mobile. Common catastrophic failures:
- Form fields too small to tap accurately
- WhatsApp button not using deep link (
wa.me/91XXXXXXXXXX) - Phone number not formatted as
<a href="tel:+91..."> - Sticky header consuming 20% of viewport
- Text below 16px minimum font size
Mobile speed deserves special attention — every 1-second delay decreases conversions by 20%. See our Core Web Vitals guide for technical fixes.
7. CRO Tools and Measurement Framework
- Microsoft Clarity (free): Heatmaps + session recordings for unlimited traffic. Integrates with GA4
- GA4 Funnel Reports: Landing Page → Form Start → Form Complete → Thank You Page
- GA4 Scroll Depth: Track if visitors reach your social proof section (typically at 60-70% scroll)
- A/B Testing: Test one variable at a time. Wait for 95%+ statistical significance
CRO improvements directly multiply paid media ROI — same budget generates 2-3× more leads when conversion rate improves from 2% to 5-6%. See how our Google Ads management integrates CRO optimization. Also explore PMax optimization and Meta Ads creative fatigue fixes. Request a free CRO audit.